|
Variable
|
Description
|
|
Time
|
The
time when the data was taken
|
|
Station
Numbers
|
The
number of the stations where data was taken
|
|
Station
Location*
|
The
location of the station under consideration
|
|
Sequence
|
The
order of occurrence of high toxicity ratings on each stations on occasion
of red-tide progression
|
|
Toxicity
Level
|
The
percentage/level of toxicity on each station
|
|
Organism
Population**
|
The
population of a specific red-tide organism present on each station
|
*Optional.
While location information is not necessary, it is useful in making conclusions
about the importance
of
each station.
**Optional.
While toxicity level is in itself enough, once the network has learned,
the network can be used to
predict
an orbital approximation of the population of the organisms than can be
found at a given station.
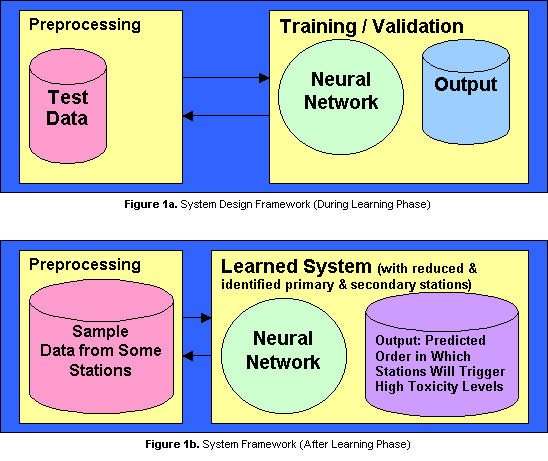
Having processed the data we feed them into the neural network continuously in random order until we an evaluation of the network reveals a consistent treatment of each station?s priority (i.e. it is able to identify the order by which each station will trigger toxic levels, at any time, when fed by data coming from selected stations only.) Training will stop once the network has achieved this consistency, in which case, the network will be able to assign priorities to the stations when given a specific scenario. Figure 1a shows the basic operational framework of the system during training and Figure 1b shows the system after its training. In summary, the framework is explained below.
During the training phase, the network is fed with a preprocessed subset of the time-series data. The goal is for the network to identify (1) patterns in the way each monitoring stations are triggered by high toxicity ratings as time progresses, (2) output some statistics for each individual station, (3)arrive at a generalization about the organism population as a function of the station numbers (or locations). Upon termination of the learning process, statistics outputted by the neural network, will be analyzed and will be used to remove redundant stations and hopefully identify gaps in the positioning of the stations over the area of coverage. Finally, the learned network can be used as a predictive tool, first for mapping the progression of red-tide from one station to another given a certain scenario, then second, for predicting the red-tide organism population that can appear at a specific station given initial data gathered by other stations.
In conclusion, artificial neural networks can be used modeling the progression of red-tide over an area of coverage given a minimal dimension of training data sets such as time, station sequence and location, toxicity, and population, is a feasible solution to the problem of reducing overhead maintenance cost of monitoring stations over a given area of coverage. Moreover, the said project can be applied used to solve similar reduction problems on other coverage areas just by re-training and on some areas, with minimal modifications to the system.
